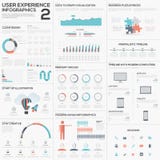
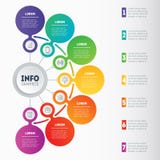
Illustration: Vector Infographics, Diagram, Chart, Graph And Presentation. Arrows, Circles, Target, Columns, Map And Timeline.
ID 124850427 © Abert84 | Megapixl.com
Vector infographics, diagram, chart, graph and presentation. Business report with 3, 4, 5, 6 and 7 options, parts steps processes Arrows circles target columns map and timeline
CATEGORIES
Sharing is not just caring, it's also about giving credit - add this image to your page and give credit to the talented photographer who captured it.:
KEYWORDS
abstract background banner brochure business chart column concept connection creative data design diagram element graph graphic icon idea illustration infochart infograph infographic information layout linear map marketing option pointer presentation process report staits step strategy stroke success symbol target technology template thin timeline vector web
More images on Dreamstime


Similar Images


More images by the same author


1 week free trial. Any size, for free
Renews at $25/month, cancel or upgrade at any time
Click here for your free trial!243,330,936 images | 1,222,382 contributors | 53,550,187 total users