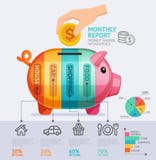
Illustration: Infographics Report. Financial Charts Diagrams Bar Chart Graph Business User Interface Design Vector Presentation
ID 143404962 © Spicytruffel | Megapixl.com
Infographics report. Financial charts diagrams bar chart graph business user interface design vector presentation infographic template set
CATEGORIES
Sharing is not just caring, it's also about giving credit - add this image to your page and give credit to the talented photographer who captured it.:
KEYWORDS
advertise annual bar brand brochure business charts cover design diagrams digital document elements experience financial flat graph graphics group icons impact info infograph infographics infography information interface kit layouts marketing media mobile page presentation pyramid report reporter reporting sampling set social statistics strategy template timeline trend user vector website
More images on Dreamstime


Similar Images


More images by the same author


1 week free trial. Any size, for free
Renews at $25/month, cancel or upgrade at any time
Click here for your free trial!240,500,801 images | 1,213,700 contributors | 53,273,366 total users