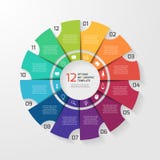
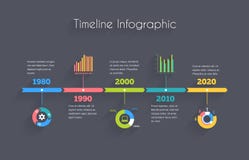
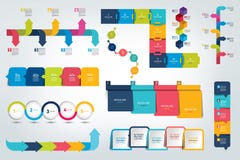
Illustration: Infographic Template With Twisted Lines. 8 Circle Options For Presentation And Data Visualization. Diagram With Eight Steps To
ID 187215489 © Arthead17 | Megapixl.com
Infographic template with twisted lines. 8 circle options for presentation and data visualization. Diagram with eight steps to success. Modern concept for brochure, timeline, infochart planning
CATEGORIES
Sharing is not just caring, it's also about giving credit - add this image to your page and give credit to the talented photographer who captured it.:
KEYWORDS
backgrounds banner brochure business circle colorful communication concept connection creative data design diagram digital element flat flowchart graph graphic icon icons idea illustration info infographic infographics information layout marketing modern option organization presentation process progress sign step strategy structure success symbol teamwork template timeline vector visualization web workflow
More images on Dreamstime


Similar Images


More images by the same author


1 week free trial. Any size, for free
Renews at $25/month, cancel or upgrade at any time
Click here for your free trial!243,106,869 images | 1,221,560 contributors | 53,528,543 total users