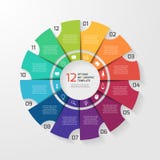
Illustration: Infographic Graphs. Diagrams, Pie Charts Progress Bars For Business Presentation, Data Comparison And Budget Report
ID 172712019 © Spicytruffel | Megapixl.com
Infographic graphs. Diagrams, pie charts progress bars for business presentation, data comparison and budget report. Vector graphic analysis set for information dashboard budget, finance
CATEGORIES
Sharing is not just caring, it's also about giving credit - add this image to your page and give credit to the talented photographer who captured it.:
KEYWORDS
analysis background bars black budget business charting charts comparison computer control dark dashboard data design designing diagrams elements finance financial forex future gradient graphic graphs hud image infograph infographic information interface isolated line manager modern monitoring organization organzation panel pie presentation progress report set statistic technology template trading vector
More images on Dreamstime


Similar Images


More images by the same author


1 week free trial. Any size, for free
Renews at $25/month, cancel or upgrade at any time
Click here for your free trial!240,988,990 images | 1,214,963 contributors | 53,326,224 total users