Illustration: Infographic Cycle Diagram. Process Chart For Business Infographics With 8 Steps, Parts, Options.
ID 218924295 © Vectorcreator | Megapixl.com
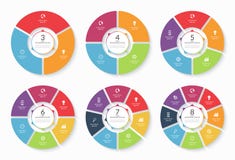
Infographic cycle diagram. Process chart for business infographics with 8 steps, parts, options. Vector template for presentation, report, brochure, web design.
CATEGORIES
Sharing is not just caring, it's also about giving credit - add this image to your page and give credit to the talented photographer who captured it.:
KEYWORDS
cycle infographic process flow chart diagram circle template 8 eight step graph vector element business circular banner brochure success plan flowchart presentation development background option part strategy abstract progress concept data information layout round pie infochart blank workflow segment report web schedule plot editable analysis research result statistics pattern
More images on Dreamstime


Similar Images


More images by the same author


1 week free trial. Any size, for free
Renews at $25/month, cancel or upgrade at any time
Click here for your free trial!243,721,291 images | 1,223,463 contributors | 53,588,001 total users