Illustration: Infographic Circle. Cycle Diagram With 5 Stages
ID 140458679 © Vectorcreator | Megapixl.com
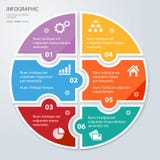
Vector infographic circle. Cycle diagram with 5 stages. Round chart that can be used for report, business analytics, data visualization and presentation.
CATEGORIES
Sharing is not just caring, it's also about giving credit - add this image to your page and give credit to the talented photographer who captured it.:
KEYWORDS
abstract banner brochure business chart circle circular connection creative cycle data design development diagram direction element five flow flowchart graph graphic illustration infochart infographic information layout management modern module option part pie plan process program report schedule section sector segment sign stage step strategy template vector web work workflow
More images on Dreamstime


Similar Images


More images by the same author


1 week free trial. Any size, for free
Renews at $25/month, cancel or upgrade at any time
Click here for your free trial!244,266,058 images | 1,225,026 contributors | 53,634,759 total users