Illustration: Good Hdl And Bad Ldl Cholesterol Movement Comparison Outline Diagram
ID 252647437 © VectorMine | Megapixl.com
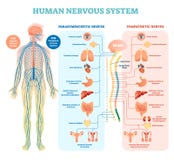
Good HDL and bad LDL cholesterol movement comparison outline diagram. Labeled educational scheme with liver function and fat cells flow to cells vector illustration. Artery disease risk explanation.
CATEGORIES
Sharing is not just caring, it's also about giving credit - add this image to your page and give credit to the talented photographer who captured it.:
KEYWORDS
good bad cholesterol blood fat hdl artery vein health care healthcare flow cardiovascular illustration disease anatomy concept vector liver vessel educational comparison biology description explanation graphic medical model physiology pressure type versus clot medicine vascular obstacle particle measurement outline diagram labeled scheme vs ldl excess cells function risk movement
More images on Dreamstime


Similar Images


More images by the same author


1 week free trial. Any size, for free
Renews at $25/month, cancel or upgrade at any time
Click here for your free trial!242,123,555 images | 1,218,445 contributors | 53,440,170 total users