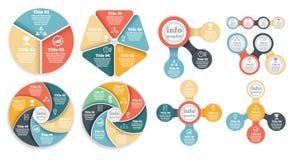
Illustration: Circle Diagram Divided Into 8 Sectors. Design Concept Of Eight Steps Or Parts Of Business Cycle. Neumorphic Infographic
ID 278683817 © Abert84 | Megapixl.com
Circle diagram divided into 8 sectors. Design concept of eight steps or parts of business cycle. Neumorphic infographic design template. Business data visualization.
CATEGORIES
Sharing is not just caring, it's also about giving credit - add this image to your page and give credit to the talented photographer who captured it.:
KEYWORDS
neumorphism neumorphic infographic 8 process circle template icon cycle vector business diagram information chart project presentation option concept banner infografity layout step circular marketing data success strategy finance plan abstract connected progress illustration symbol graph label round element part structure analysis graphic
More images on Dreamstime


Similar Images


More images by the same author


1 week free trial. Any size, for free
Renews at $25/month, cancel or upgrade at any time
Click here for your free trial!243,875,441 images | 1,223,858 contributors | 53,601,737 total users