Illustration: Business Data Visualization. 6 Steps, Options, Processes, Segments.
ID 281407307 © Thanyasiritj | Megapixl.com
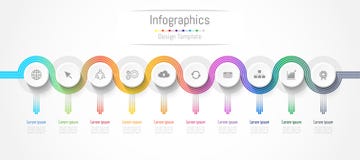
Business data visualization. 6 steps,options,processes,segments. Infographic design template. Can be used for presentations,reports,web designs,and workflows.
CATEGORIES
Sharing is not just caring, it's also about giving credit - add this image to your page and give credit to the talented photographer who captured it.:
KEYWORDS
print business data visualization steps options processes segments infographic design template used presentations reports web designs workflows option report step graph diagram infographic plan brochure layout number presentation process chart marketing map 3d arrow label timeline idea information structure success data graphic workflow web circular business technology element template
More images on Dreamstime


Similar Images


More images by the same author


1 week free trial. Any size, for free
Renews at $25/month, cancel or upgrade at any time
Click here for your free trial!245,448,190 images | 1,227,997 contributors | 53,730,646 total users